2025 Impact Targets: Economic Security
In Economic Security the Foundation's investments of funding, and our institutional investment beyond grantmaking, are aimed at long term, demonstrable improvements in household financial stability and household wealth.

Median household income of $78,000
The median income among Rhode Island households steadily increased from $56,000 in 2012 to nearly $75,000 in 2021. This is above the US average of $69,021 and sets RI in the middle among New England states (MA leads at $89,026 and ME trails at $63,182).

50% reduction in economic disparities
While incomes have risen overall in Rhode Island, as shown in the chart above and the comparison chart here, there continues to be persistent income inequality by race and ethnicity. In 2021, non-Hispanic White households in Rhode Island earned on average 35%-50% more than Black, Hispanic, and American Indian households. These same patterns of disparities persist in many areas, including in educational and health outcomes.

45,000 net new jobs
In 2019 Rhode Island reported a record year-end employment figure of more than 505,000 jobs with growth in the areas of accommodation & food service, professional & technical services, management, and health care. After a big drop in 2020 as a result of the COVID-19 pandemic, job growth climbed again to end 2022 at 497,300.
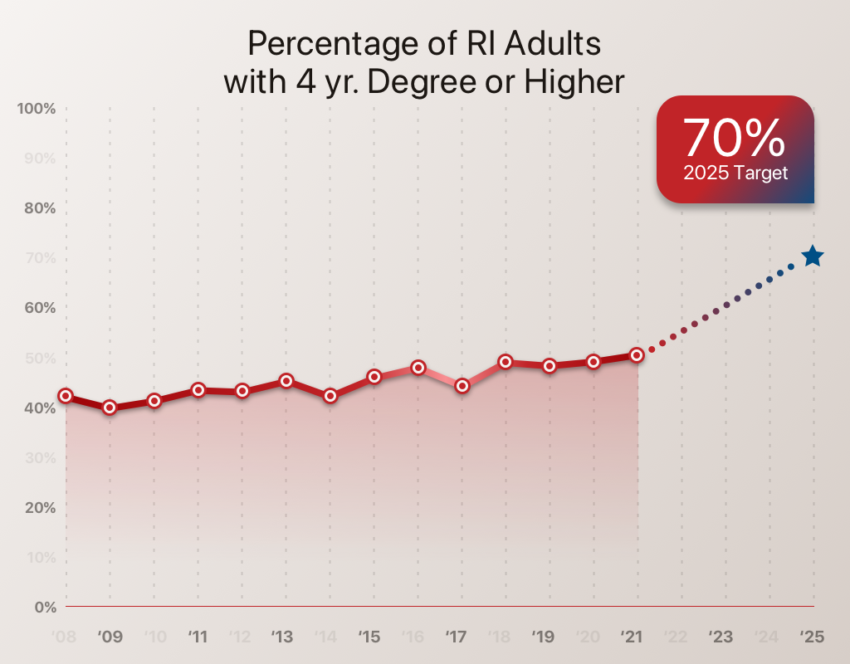
70% of Rhode Islanders have a credential or degree
The state adopted this goal of 70% by 2025 to meet workforce needs and ensure that Rhode Islanders are ready to assume available well-paying jobs: Higher levels of education and credentialing will translate to higher wages. While progress between years fluctuates, the state is seeing slow but steady progress in increasing college degree attainment – from 40% in 2009 to 52% in 2021.

.40 on the Gini index
The Gini Index is named after an Italian economist who developed the measure in 1912. It is widely used to measure income inequality and results range from 0 to 1. A score of 0 indicates perfect equality in wealth distribution whereas a score of 1 shows absolute inequality (where only one recipient or group receives all the income). Inequality in the US is increasing: the 2019 Gini index was .48 compared with .43 in 1990. Rhode Island’s rate was .46 in 2021, a slight drop from the steady .47 of the past decade.

Learn about the 2025 impact targets for our other sectors
Learn about the data informing progress in Long Term Education Planning and Long Term Health Planning
Sources: US Census Bureau American Community Survey 5-year estimates and 1-year estimates, US Bureau of Labor Statistics Current Employment Survey, PolicyMap.